

Last updated: October 2, 2026
Synthetic benchmarks isolate peak theoretical silicon performance under mathematically controlled loops. Gaming benchmarks measure variable real-world graphics execution across dynamic game engines, system memory pipelines, and driver revisions. Evaluating hardware in October 2026 requires understanding both test suites to avoid spending budget on compute capability game rendering pipelines never saturate.
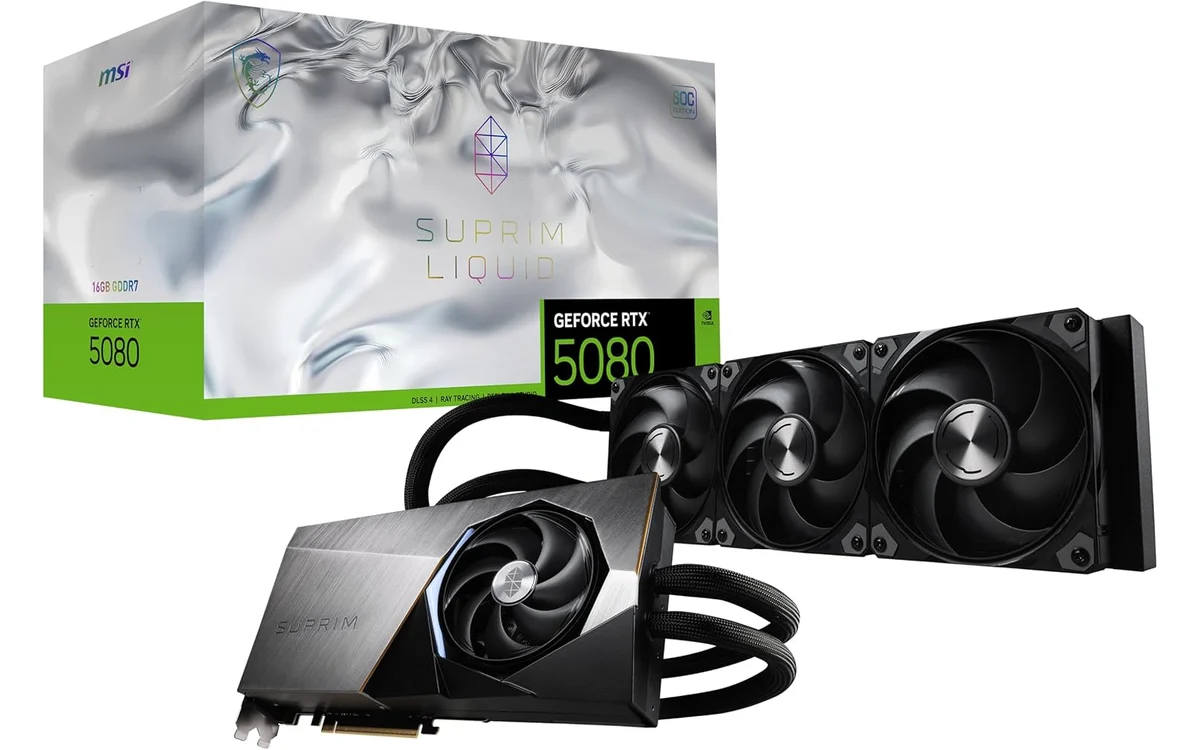
Synthetic tests reveal architectural limits, compute density, and thermal throttling behaviors. Real game workloads expose driver overhead, VRAM bandwidth limits, game engine thread scheduling flaws, and dynamic frame pacing issues. Both testing categories form foundation of hardware evaluation inside GPU Benchmarks analysis.
What Is Synthetic Vs Gaming Benchmarks?
Synthetic benchmarks run deterministic mathematical equations to stress specific hardware execution blocks. These programs—like 3DMark Time Spy, FurMark, or Cinebench—do not emulate consumer software. Instead, synthetic benchmarks saturate floating-point units, matrix cores, memory buses, or cache hierarchies with predictable workloads. Output generates standardized numeric score.
Gaming benchmarks execute real commercial game code through rendering engines like Unreal Engine, Unity, or proprietary developer technology. Workloads run deterministic scripted camera passes or recorded user gameplay loops. Output measures frames per second, 1% low frame rates, 0.1% low frame times, and rendering latency milliseconds rather than abstract points.
Why Synthetic Vs Gaming Benchmarks Matters
Hardware buyers frequently misallocate funds by relying on single metric category. High synthetic score does not guarantee smooth gameplay frame delivery. Silicon architectures scale differently depending on instruction sets, driver optimizations, and cache usage.
Graphics cards designed with massive raw theoretical compute compute raw matrix instructions rapidly in synthetic tests. Yet in actual games, graphics pipeline encounters texture streaming bottlenecks, asynchronous compute stalls, draw call limits, and asset decompression delays. Conversely, CPUs with immense L3 cache, such as AMD X3D processors, produce modest synthetic rendering scores in pure arithmetic suites while dominating real gaming framerate charts.
Workload isolation dictates real value. Synthetic benchmarks reveal whether cooler mounts properly, silicon maintains rated clock speeds, or power delivery components overheat under full load. Gaming benchmarks reveal whether graphics card runs stutter-free at native 4K resolution, handles ray tracing overhead, or runs out of video memory pool.
How Synthetic Vs Gaming Benchmarks Works
Understanding execution paths shows why these benchmark methodologies yield conflicting product conclusions.
Deterministic Compute vs Dynamic Render Pipelines
Synthetic software generates static asset pipelines. Every run loads identical polygons, fixed lighting coordinates, unvarying shader routines, and locked camera sweeps. Code bypasses physics calculations, artificial intelligence pathfinding, network network packet parsing, and dynamic audio queues. Silicon executes pure vector mathematics, geometry calculations, or rasterization passes. If GPU hardware contains 10,000 arithmetic logic units, synthetic suite saturates all 10,000 units continuously.
Gaming suites force graphics card and processor to communicate continuously across PCIe interface. CPU prepares draw calls, calculates game world state, updates skeletal animations, and sends render instructions to GPU. GPU processes geometry, maps textures from local VRAM, executes compute shaders for particle effects, and applies post-processing filters. Any pipeline delay stalls entire process, causing frame drops synthetic tests never trigger.
API Utilization and Driver Optimization
Synthetic suites target precise API features under Microsoft DirectX 12 Ultimate or Vulkan. Graphics driver vendors—NVIDIA, AMD, and Intel—optimize drivers directly for synthetic code loops. Benchmark software developers publish explicit technical specifications detailing shader complexity and buffer allocation rules.
Game releases rely on varied API implementations. Some developers optimize for console unified memory architecture, leaving PC ports with poor memory defragmentation, erratic shader compilation stutters, and inefficient multicore CPU scheduling. Driver teams must deploy bespoke game-ready driver updates to fix engine-level pipeline stalls. High synthetic performance cannot overcome unoptimized game engine code.
Frame Times Versus Composite Point Scores
Synthetic tools compress run results into single numerical index, like 15,000 points. Index hides temporal variance. Graphics card could deliver micro-stutters, erratic thermal throttling intervals, or brief visual artifacts while achieving high composite rating.
Game performance analysis relies on frame time analysis measured in milliseconds. Generating 60 frames per second requires steady 16.6-millisecond render cadence per frame. If card delivers 59 frames at 10 milliseconds and single frame stalls at 410 milliseconds, average framerate appears acceptable, but user sees jarring stutter. Game benchmarks capture 1% low and 0.1% low thresholds, exposing frame delivery instability.
What to Look For When Buying
Use structured evaluation process when checking benchmark reviews before purchasing components:
- Verify 1% low frame time metrics instead of looking strictly at average frames per second in game benchmarks.
- Check synthetic sustained stress tests to confirm cooler thermal dissipation capacity and clock stability without frequency drops.
- Review game tests running native resolutions without frame generation or temporal upscaling enabled to see raw hardware capability.
- Check real-world game engine tests matching personal software library genres, such as Unreal Engine 5 or simulation titles.
- Cross-reference CPU gaming results with dedicated CPU Benchmarks data to detect platform bottlenecks.
- Examine VRAM consumption limits in game tests running high-resolution texture packs.
Common Mistakes to Avoid
Hardware buyers regularly make predictable errors when reading benchmark charts:
Equating Synthetic Score to Game Framerates: A GPU leading competitors by 15% in 3DMark Time Spy Extreme may trail those same competitors in real game engines due to architecture cache bandwidth, memory bus widths, or texture mapping unit configurations.
Ignoring System Bottlenecks: Evaluating GPU gaming charts without noting testbed CPU creates false expectations. Fast graphics cards produce low frame rates when paired with older processors that bottleneck draw call delivery.
Relying on Built-In In-Game Benchmarks Exclusively: Built-in game benchmark loops run pre-baked fly-through sequences. Sequences often stress GPU rasterization while omitting player input processing, physics, and intensive non-player character calculations present during live gameplay.
Dismissing Synthetic Thermal Stress Data: Users buying parts based solely on short game loops sometimes discover systems overheat during sustained multi-hour sessions. Synthetic power loops expose VRM thermal saturation and cooling mounting pressure defects quickly.
Quick Comparison
Summary table compares primary differences between synthetic and gaming benchmark types:
| Benchmark Metric | Synthetic Tests | Gaming Benchmarks | Primary Value |
|---|---|---|---|
| Primary Measurement | Arbitrary points, raw compute GFLOPS | FPS, 1% low frame times, latency (ms) | Identifies real versus theoretical capability |
| Execution Workload | Deterministic math, static scene assets | Dynamic game engine, asset streaming | Tests real hardware-software pipeline |
| Hardware Stress Focus | Peak compute units, cache, VRM thermals | Memory latency, CPU draw calls, VRAM pool | Identifies component bottlenecks |
| Driver Sensitivity | Isolated, predictable, vendor-optimized | High variance across patches and versions | Reveals software support quality |
| Reproducibility | Near 100% run-to-run consistency | Variable depending on gameplay factors | Enables precise hardware A/B comparison |
Related Guides
Explore additional hardware analysis guides across our testing network:
- Consult parent category Benchmarks for broad methodology concepts.
- Understand cooling limits with our guide on safe CPU temperature while gaming.
- Plan platform migrations using Best Ryzen 5 3600 Upgrades.
- Review graphics metrics within our dedicated GPU Benchmarks section.
Why You Should Trust PCGearWiki
PCGearWiki relies on systematic specification verification, hardware whitepaper analysis, and strict testing methodology. We eliminate marketing claims, vendor bias, and fabricated metrics. Recommendations prioritize real component capabilities, verifiable architectural facts, and practical consumer value. Read our full protocol on How We Evaluate Products to understand our research standards.
Final Thoughts
Synthetic benchmarks serve as reliable diagnostic tools to isolate raw compute potential, diagnose clock throttling, verify system stability, and compare architectural changes under uniform conditions. Gaming benchmarks measure actual user experience by exposing driver interactions, memory bandwidth limitations, engine-level optimizations, and frame time consistency. Never purchase hardware based on synthetic point totals alone; verify gaming frame pacing across target resolutions and engine APIs first.
Frequently Asked Questions
Can high synthetic scores guarantee high gaming FPS?
No. High synthetic scores indicate raw computational throughput under controlled conditions. Real games introduce draw-call limits, game engine scheduling bottlenecks, and asset streaming delays. If card lacks memory bandwidth or driver optimization for specific title, high synthetic point totals will not prevent frame drops.
Why do reviewers use synthetic benchmarks if games differ?
Synthetic suites provide pure repeatability. Game patches, operating system background tasks, and player movement introduce run variance. Synthetic tests run exact mathematical loops across fixed time intervals, making them ideal for diagnosing hardware defects, thermal limits, and architectural changes across hardware generations.
What does a 1% low frame rate mean in gaming tests?
The 1% low metric measures average frame rate of lowest one percent of frames rendered during benchmark. This metric highlights brief stutters and latency spikes. A game averaging 100 FPS with 30 FPS 1% lows feels visibly jerky compared to game averaging 80 FPS with 75 FPS 1% lows.
Are built-in game benchmarks as accurate as real gameplay captures?
Built-in benchmarks provide consistent repeatability for comparative reviews, but often underestimate CPU load. Pre-rendered camera tracks omit real-time player input, physics calculations, and multiplayer networking routines. Manual gameplay captures using telemetry tools provide more accurate representations of real gameplay stability.


Write Your Review
No reviews yet. Be the first to share your experience!